Monitor Device Compliance Trends and Track — Security Impact and Response Guide

Monitor Device Compliance Trends and Track — Security Impact and Response Guide
I walked into a security review last year where the CISO was convinced their endpoint posture was solid. Intune was deployed. Compliance policies were configured. Conditional Access was enforcing them. On paper, everything was fine.
📊 The Difference Between Status and Signal
Most Intune deployments are built around compliance status — a point-in-time view of which devices are compliant, non-compliant, or in grace period. That view is useful for reactive triage. It is not useful for governance.
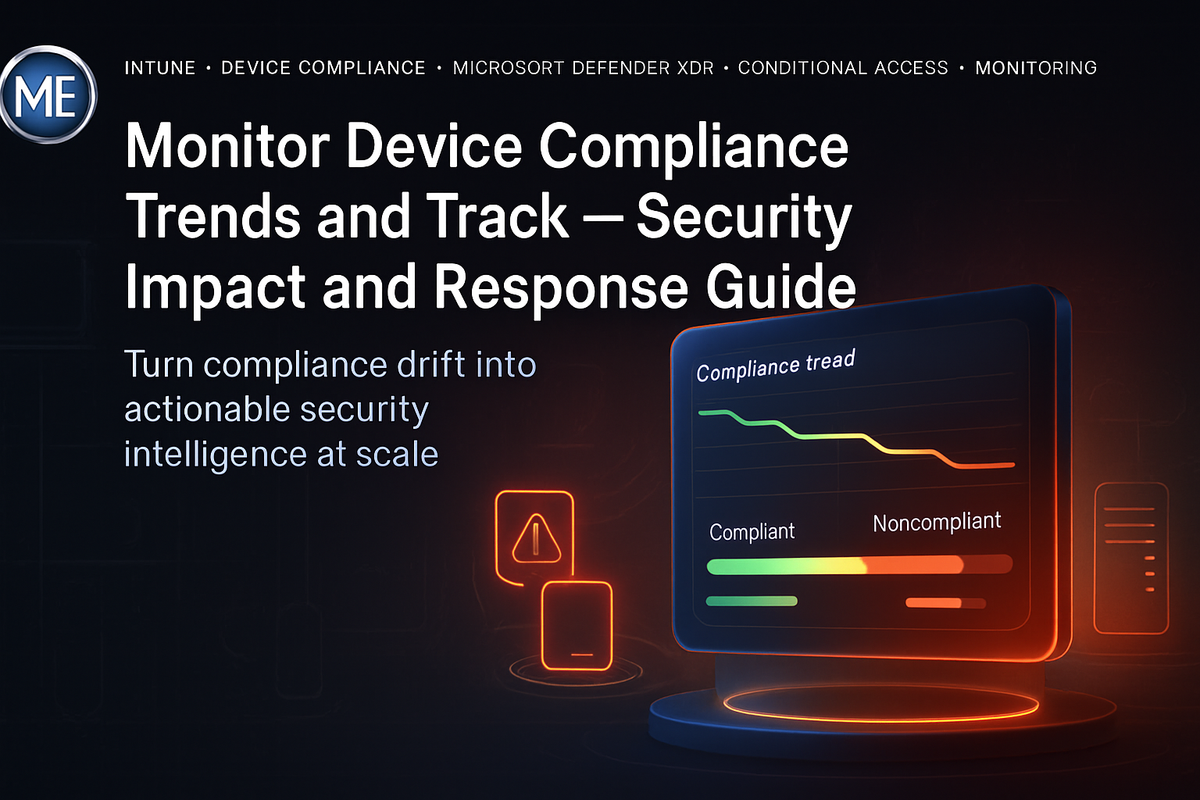
Compliance trend data is a different category of signal entirely. The Device Compliance Trends report in the Intune admin center tracks aggregated compliance state across your managed device population over a rolling 30-day window. It does not just tell you where you are. It tells you whether you are improving, degrading, or oscillating — and oscillation is often the most dangerous pattern of all.
The report lives at Reports > Device Compliance > Reports > Device Compliance Trends in the Microsoft Intune admin center. The navigation path is simple. The interpretation is not.
What you see in that report is not just a compliance health indicator. It is a lagging signal of your policy enforcement model, your device lifecycle management, your patching operations, and your Conditional Access architecture — all rolled into one chart.
🔍 What Trend Patterns Actually Tell You
I've seen every shape of compliance trend in enterprise deployments. Each pattern tells a different operational story.
A steady decline over 30 days almost always points to a policy change that was not validated before production rollout, a Windows Update ring that is enforcing compliance settings the device population cannot meet, or a certificate that expired silently.
A sawtooth pattern — compliance rising and falling week over week — usually signals grace period misconfiguration. Devices are bouncing in and out of compliance because the grace period resets without triggering remediation. That pattern is operationally invisible if you only check status dashboards.
A sudden cliff drop followed by a plateau is a deployment event. A new compliance policy was pushed, or a policy scope was expanded to a previously excluded group. The cliff tells you when. The plateau tells you whether remediation is keeping up.
⚠️ The Governance Gap Nobody Talks About
Here is what I observe consistently across enterprise Intune deployments: organizations invest heavily in building compliance policies, and almost nothing in monitoring the sustained effectiveness of those policies over time.
A policy is written. It is tested in a pilot group. It is deployed. The deployment succeeds. That is where the attention ends.
Six months later, the policy still exists. But the device population has changed. New hardware profiles have been onboarded. A Windows feature update has shifted the OS build compliance baseline. A certificate used in a compliance check has been renewed with a different thumbprint. None of these events generate an automatic alert. They generate compliance drift — and drift only becomes visible in trend data.
Grace period settings create a dangerous blind spot in compliance trend analysis. Devices in grace period appear in a separate compliance state category that is often excluded from executive dashboards. A growing grace period population is frequently a leading indicator of a coming non-compliance spike — not a sign that remediation is working.
The governance gap is not technical. Intune provides the data. The gap is operational: nobody owns the trend data, nobody reviews it on a defined cadence, and nobody has defined what a "compliance degradation event" looks like so it can trigger a response.
🔐 Security Impact: Why Trends Matter More Than Snapshots in a Zero Trust Architecture
If you are operating a Zero Trust model where Conditional Access uses device compliance as a trust signal, trend data becomes a security control input — not just a reporting output.
Consider the attack path: an adversary compromises a device that was compliant at last check-in but has since drifted. The device holds a valid Primary Refresh Token. Conditional Access sees a compliant device signal from the last evaluation. The session continues. The attacker moves laterally.
This is not a theoretical scenario. I've seen it surface in incident response engagements where the initial access vector was a device that had been compliant at enrollment but had drifted over weeks without anyone detecting the change.
The mitigation is not just enforcing compliance at authentication — it is continuously monitoring the rate and direction of compliance change so that degrading populations trigger investigation before they become access risk.
Pair the Device Compliance Trends report with Intune's non-compliant device list filtered by last check-in time. Devices that are non-compliant AND have not checked in for more than 14 days are your highest-priority investigation targets — they represent both a policy gap and a potential unmanaged endpoint.
For organizations running Microsoft Defender for Endpoint alongside Intune, the device risk score from Defender integrates with compliance policy evaluation. A device with a "High" risk level in Defender can be flagged as non-compliant in Intune automatically. When you are reading compliance trend data, a spike in non-compliance that correlates with a Defender for Endpoint threat detection wave tells a very different story than a spike caused by a certificate expiry. The trend data is the same. The response is completely different. That context comes from cross-referencing signals.
Reference: Monitor device compliance policies in Intune
🧩 Extending Compliance Trends Into Operational Response
Reading the trend is step one. Connecting it to an operational response model is where the architecture matters.
In my experience, the organizations that get the most value from compliance trend data are the ones who have defined explicit compliance degradation thresholds that trigger specific response workflows. Not vague thresholds like "if compliance drops, investigate" — specific ones like: if non-compliant device count increases by more than 5 percent week-over-week, the Intune administrator initiates a policy audit within 24 hours.
For organizations that have extended Intune data into Azure Log Analytics, you can build custom alerts on compliance trend movement that go beyond what the built-in Intune reports surface. This is not a configuration luxury for mature shops — it is a governance necessity for any organization running more than a few thousand endpoints.
A basic KQL query to surface devices that have transitioned from compliant to non-compliant in the last 7 days:
IntuneDeviceComplianceOrg
| where TimeGenerated > ago(7d)
| where ComplianceState == "noncompliant"
| summarize Count = dcount(DeviceName) by bin(TimeGenerated, 1d)
| order by TimeGenerated desc
This does not replace the built-in trend report. It extends it into your operational tooling, where alerts can be routed to the right team at the right time.
Reference: Create custom dashboards and alerts using Intune and Azure Log Analytics
🚫 What This Technology Does NOT Solve
The Device Compliance Trends report is a monitoring capability. It is not a remediation engine.
It will not automatically fix a non-compliant device. It will not re-push a failed policy. It will not notify the device owner. It will not block access on its own — that requires Conditional Access integration, which is a separate architectural layer.
Trend data also does not tell you why a device is non-compliant. A spike in non-compliant devices in the trend chart is a signal that something changed. Diagnosing what changed requires drilling into per-device compliance reports, policy assignment logs, and Intune device configuration profiles. The trend is the smoke alarm. Investigation is the fire marshal's job.
Trend data also does not account for device population changes. If 500 new devices were enrolled in the last 30 days, the trend chart will show a compliance shift that reflects enrollment state variability, not policy degradation. Reading trend data without knowing your enrollment activity creates false signal.
🎯 Final Architect Recommendation
If I were advising a customer today, my guidance would be direct: stop treating the Device Compliance Trends report as a passive reporting dashboard and start treating it as an active governance instrument.
Deploy the built-in report immediately — it costs nothing and requires no additional configuration. But do not stop there. Define what a compliance degradation event looks like for your organization within the first 30 days of deployment. Establish a weekly review cadence. Assign an owner who is accountable for compliance trend direction, not just compliance policy configuration.
For organizations with more than 2,000 managed endpoints, I would not consider the monitoring architecture complete without Log Analytics integration. The 30-day built-in window is not sufficient for regulatory environments, and the absence of alerting in the built-in report means compliance degradation will always be discovered late.
For organizations already running Microsoft Defender for Endpoint, cross-referencing compliance trend spikes with Defender device risk signals is not optional — it is the difference between knowing you have non-compliant devices and understanding whether those non-compliant devices represent active security risk.
What I would postpone: building elaborate Power BI dashboards before the operational response model is defined. I have seen organizations spend weeks building compliance reporting aesthetics while the underlying compliance posture degraded. The report is not the governance. The response to what the report shows is the governance.
What I would never do: treat a stable compliance trend as a signal that nothing needs attention. Stability in trend data means the current population is holding its state — it does not mean new enrollments are being handled correctly, policy scope is accurate, or that the policies themselves still reflect current security requirements. Static governance decays. Review cycles prevent that decay.
The organizations that do this well do not have better tools. They have better operational habits built around the tools they already have.
🎯 The Takeaway
- If your compliance monitoring relies on point-in-time status views, you are managing snapshots not posture. Trend data is the governance signal — build your review processes around it, not around daily dashboard checks.
- Always define a compliance degradation threshold before expanding policy scope. More policies without a monitoring and response model creates operational noise that erodes the signal value of trend data.
- If your organization manages more than 2,000 endpoints, route compliance trend data into Log Analytics and configure threshold-based alerting. The built-in 30-day report window and absence of automated alerting make it insufficient as a standalone governance tool at enterprise scale.
- When a compliance trend spike occurs, cross-reference with Defender for Endpoint device risk signals before determining the response. A spike driven by threat detections requires a security response. A spike driven by a policy misconfiguration requires an operational response. The trend data alone cannot tell you which one you are dealing with.
- Assign a named owner for compliance trend governance with a defined weekly review cadence. Compliance monitoring that has no owner and no review rhythm will be checked when something breaks — which is exactly when it is too late to prevent the impact.